The Product Focus page provides an overview of the data included in the next six page. This data includes:
- Net Contribution and Net Contribution per Account
- Net Contribution and Net Margin
- Net Contribution per Account and Accounts
Net Contribution and Net Contribution per Account: Deposit Products
The Net Contribution and Net Contribution per Account: Deposit Products page displays a stacked dual axis graph that indicates each product's total net contribution as well as the average net contribution per account.
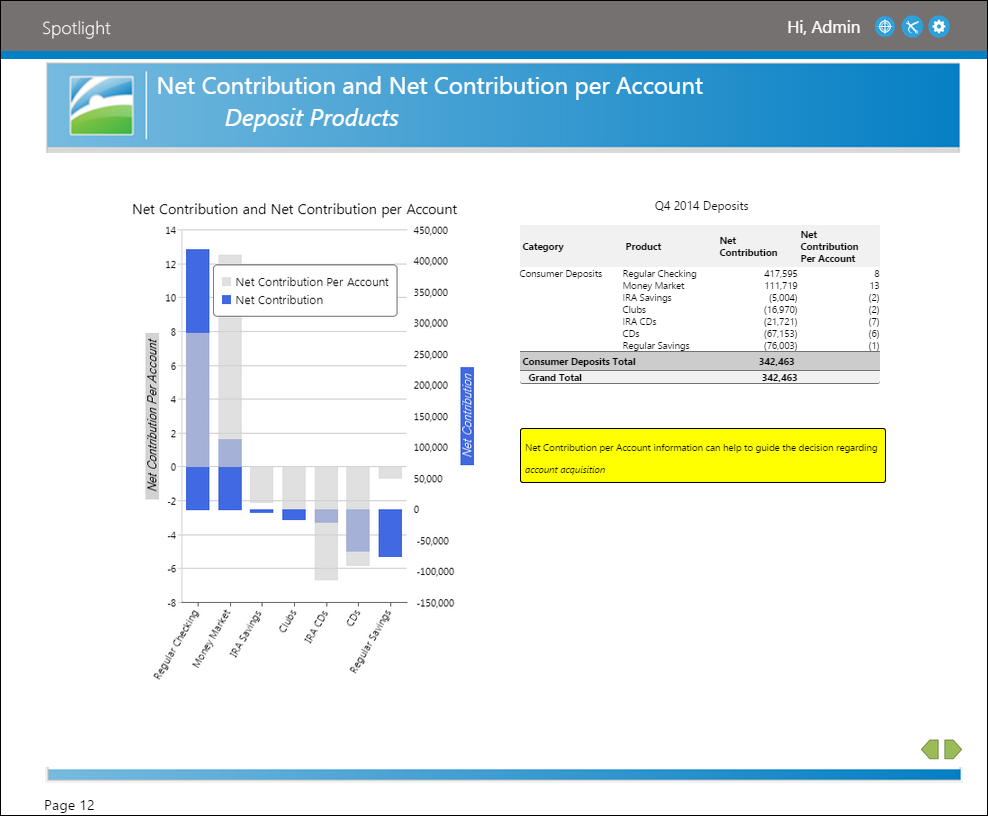
In this graph, the x-axis indicates the deposit products offered by an institution. Each product displays as a stacked bar that contains blue and grey portions. The left y-axis corresponds with the grey portion of the bar and represents the average net contribution per account. The right y-axis corresponds with the blue portion of the bar and represents the total net contribution.
The Net Contribution and Net Contribution per Account data table displays the following net contribution data:
| Column | Description |
| Category | Indicates the category which the deposit product belongs to. For example: consumer and commercial deposits |
| Product | Indicates the product type. For example: CDs and Money Market |
| Net Contribution | Indicates a product's net contribution for the current quarter. |
| Net Contribution Per Account | Indicates a product's average net contribution divided by the number of outstanding accounts for the current quarter. |
 |
Negative values are indicated in parenthesis. |
Net Contribution and Net Contribution per Account: Loan Products
The Net Contribution and Net Contribution per Account: Loan Products page displays a stacked dual axis bar graph that indicates each product's total net contribution as well as the average net contribution per account.
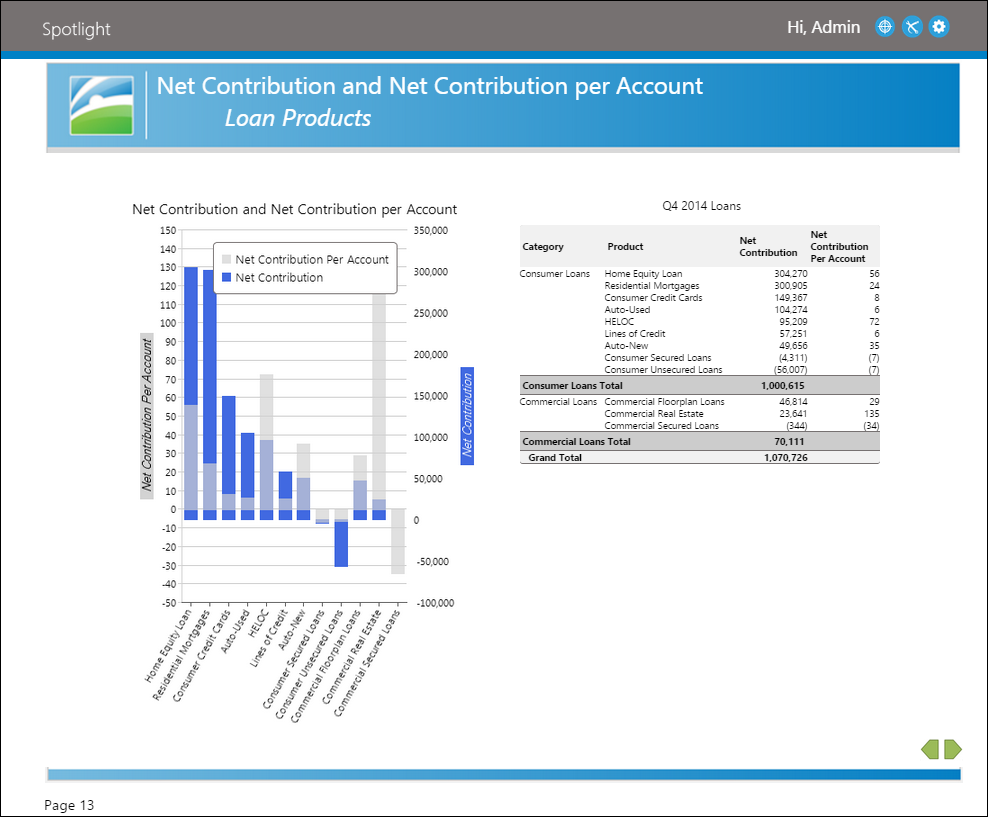
In this graph, the x-axis indicates the loan products offered by an institution. Each product displays as a stacked bar that contains blue and grey portions. The left y-axis corresponds with the grey portion of the bar and represents the average net contribution per account. The right y-axis corresponds with the blue portion of the bar and represents the total net contribution.
The Net Contribution and Net Contribution per Account data table displays the following:
| Column | Description |
| Category | Indicates the category which the loan product belongs to. For example: consumer and commercial loans |
| Product | Indicates the product type. For example: Auto-New and HELOC |
| Net Contribution | Indicates a product's net contribution for the current quarter. |
| Net Contribution Per Account | Indicates a product's average net contribution divided by number of outstanding accounts for the current quarter. |
|
Negative values are indicated in parenthesis. |
Net Contribution and Net Margin: Deposit Products
The Net Contribution and Net Margin: Deposit Products page displays a stacked dual axis bar graph that indicates total net contribution as well as the net margin for each deposit product.
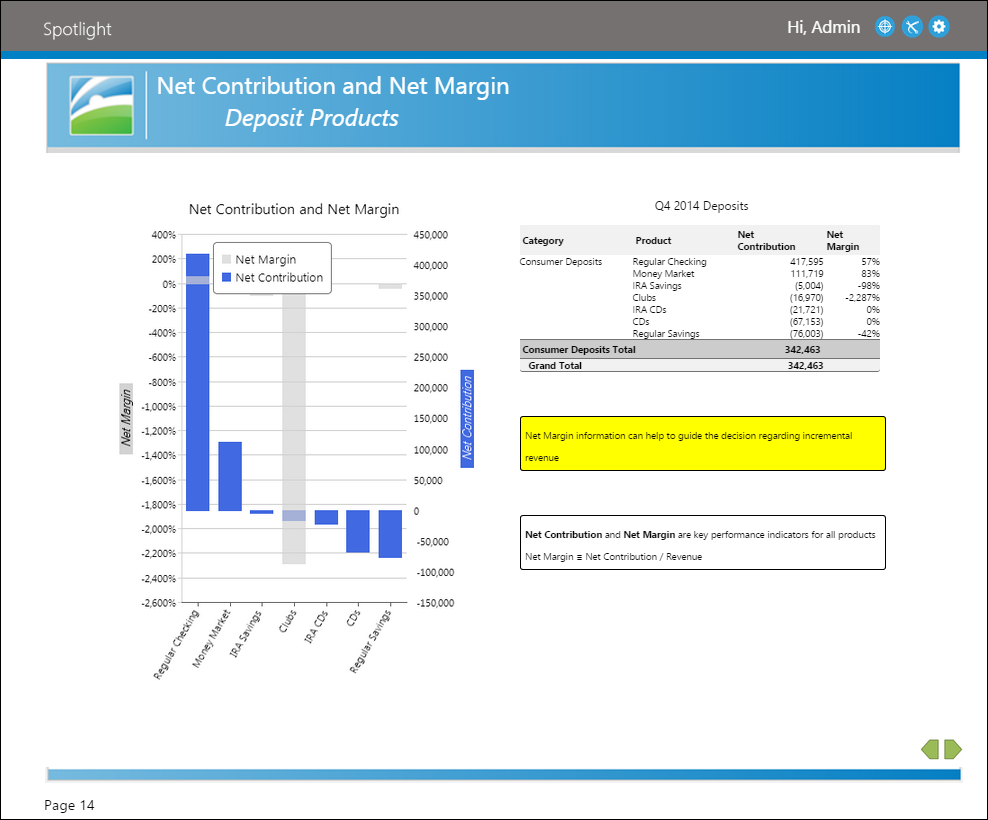
In this graph, the x-axis indicates the deposit products offered by an institution. Each product displays a stacked bar that contains blue and grey portions. The left y-axis corresponds with the grey portion of the bar and represents the net margin. The right y-axis corresponds with the blue portion of the bar and represents the net contribution.
The Net Contribution and Net Margin data table displays the following:
| Column | Description |
| Category | Indicates the category which the deposit product belongs to. For example: consumer and commercial deposits |
| Product | Indicates the product type. For example: CDs and Money Market |
| Net Contribution | Indicates a product's net contribution for the current quarter. |
| Net Margin | Indicates the product's net contribution divided by revenue. |
|
Negative Net Contribution values are indicated in parenthesis. |
Net Contribution and Net Margin: Loan Products
The Net Contribution and Net Margin: Loan Products page displays a stacked dual axis bar graph that indicates total net contribution as well as the net margin for each loan product.
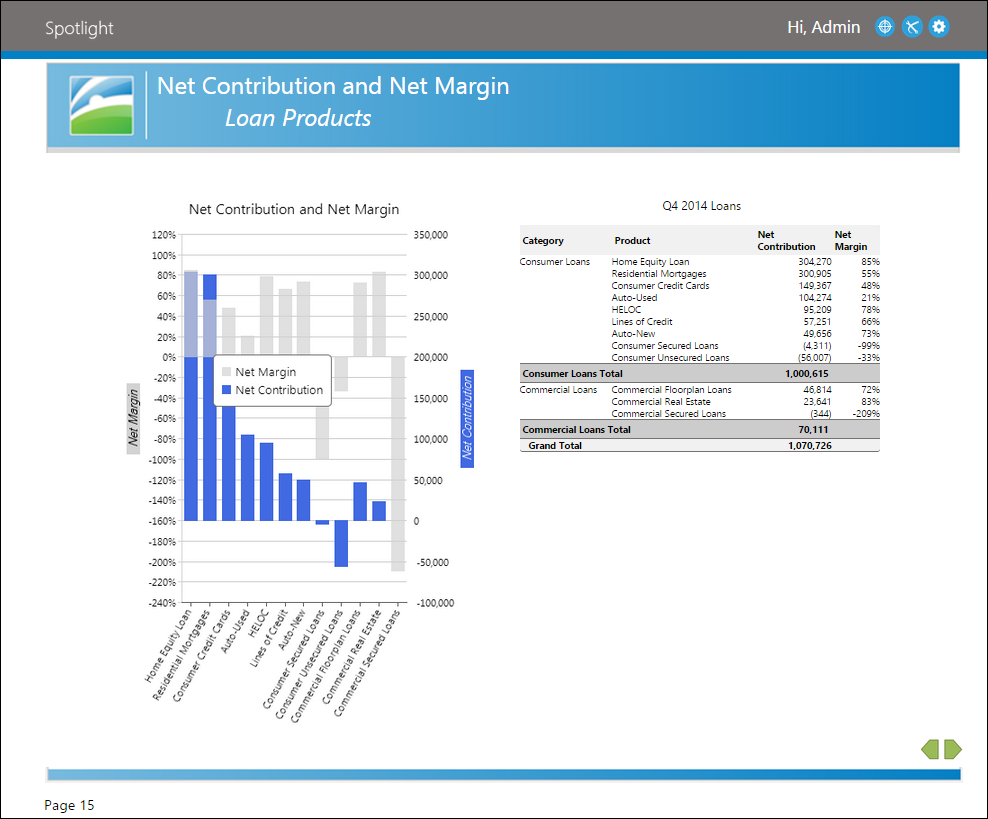
In this graph, the x-axis indicates the deposit products offered by an institution. Each product displays a stacked bar that contains blue and grey portions. The left y-axis corresponds with the grey portion of the bar and represents the net margin. The right y-axis corresponds with the blue portion of the bar and represents the net contribution.
The Net Contribution and Net Margin data table displays the following:
| Column | Description |
| Category | Indicates the category which the deposit product belongs to. For example: consumer and commercial loans |
| Product | Indicates the product type. For example: Auto-New and HELOC |
| Net Contribution | Indicates a product's net contribution for the current quarter. |
| Net Margin | Indicates the product's net contribution divided by revenue. |
|
Negative Net Contribution values are indicated in parenthesis. |
Net Contribution per Account and Accounts: Deposit Products
The Net Contribution per Account and Accounts: Deposit Products page displays a stacked dual axis bar graph that indicates each product's number of open accounts as well as the average net contribution per account.
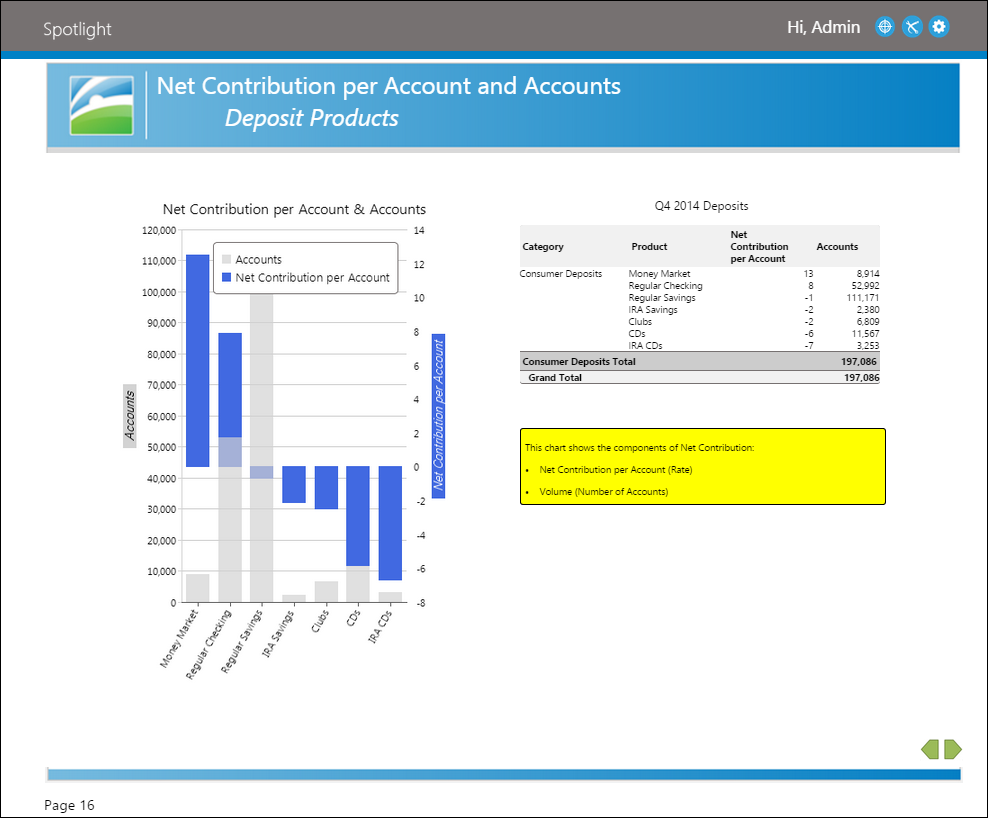
In this graph, the x-axis indicates the deposit products offered by an institution. Each product displays a stacked bar that contains blue and grey portions. The left y-axis corresponds with the grey portion of the bar and represents the number of open accounts. The right y-axis corresponds with the blue portion of the bar and represents the average net contribution per account.
The Net Contribution per Account and Accounts data table displays the following:
| Column | Description |
| Category | Indicates the category which the deposit product belongs to. For example: consumer and commercial deposits |
| Product | Indicates the product type. For example: CDs and Money Market |
| Net Contribution Per Account | Indicates a product's average net contribution divided by number of outstanding accounts for the current quarter. |
| Accounts | Indicates a product's number of outstanding accounts for the current quarter. |
Net Contribution per Account and Accounts: Loan Products
The Net Contribution and Net Contribution per Account: Deposit Products page displays a stacked dual axis bar graph that indicates each product's number of open accounts as well as the average net contribution per account.
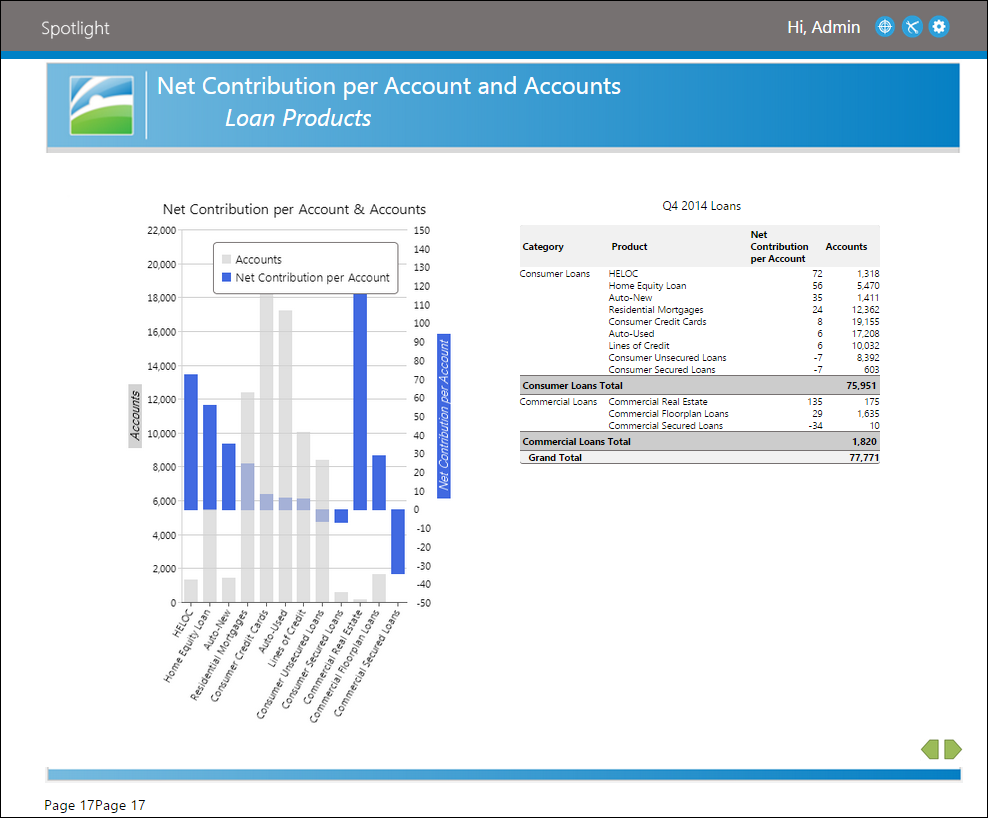
In this graph, the x-axis indicates the loan products offered by an institution. Each product displays a stacked bar that contains blue and grey portions. The left y-axis corresponds with the grey portion of the bar and represents the number of open accounts. The right y-axis corresponds with the blue portion of the bar and represents the average net contribution per account.
The Net Contribution per Account and Accounts data table displays the following:
| Column | Description |
| Category | Indicates the category which the loan product belongs to. For example: consumer and commercial loans |
| Product | Indicates the product type. For example: Auto-New and HELOC |
| Net Contribution Per Account | Indicates a product's average net contribution divided by number of outstanding accounts for the current quarter. |
| Accounts | Indicates a product's number of outstanding accounts for the current quarter. |